
INSIDER'S GUIDE TO TRADING
Unusual Options Activity
Everything you've ever wanted to know about unusual options activity—in one convenient insider's guide.
How To Find Unusual Options Activity
There are many different ways to find trade ideas. There is fundamental research, technical analysis, and order flow analysis. Inside each of these categories, there are dozens of different strategies—most of which go in and out of favor. However, the one strategy that has stood the test of time, in our experience, is using unusual options activity to find trade ideas.
Unusual options activity is how we “Follow the Smart Money” in our trades. When Wall Street moves into (or out of) a company, sector, or theme, the smaller options market is often the first place it’s noticeable. These leveraged equity instruments give someone the right (but not the obligation) to buy or sell a security at a specific price on a specific date. By looking at options activity, we can see the footprints of how they’re moving before the rest of the market does.
On this page, we will give you the insider’s guide to how you can identify, screen, and trade unusual options activity—just the way Jon Najarian, Pete Najarian, and a team of our Market Rebellion analysts do. Specifically, we will define what makes options activity “unusual,” tell you why we trade this strategy, how you can find and screen trade ideas, provide you with an overview of trade alerts, and then connect you with additional resources to learn more.
Get a Free Copy of this Insider's Guide
Everything you’ve ever wanted to know about Unusual Options Activity—in one convenient insider’s guide.

What is unusual options activity?
Unusual options activity is an order flow strategy. It looks at where options (calls or puts) are being bought, primarily compared against historic or “normal” levels.
In the options market, that’s a trade that stands out so much you can’t help but notice it; a trade—or, more frequently, series of trades—with essentially no explanation other than someone must know the stock price is going in one direction or the other.
In simple terms, you are looking for a trade that makes you say “hmmm…” In even simpler terms, you are looking for a polar bear walking on a beach.
Insiders offer one easy explanation for the source of unusual options activity. The dirty secret on Wall Street is that often news leaks, of earnings reports, upgrades or downgrades, drug trials, or other major, market-moving news, in advance of the news becoming public. And when news leaks, there are some greedy insiders who try to take advantage.
But there’s another explanation for the “Smart Money” in unusual options activity: Wall Street hedge funds, pension funds, and other big money traders amassing huge positions. These positions ultimately move stock prices in big ways, but the cause and effect may not be immediate.
When trying to add (or remove) a big position, these Wall Street firms will use all the tools available to them: listed exchanges, dark pools, and options markets. Their goal is to be inconspicuous. And to do that, they have to try to mask their activity.
However, options markets are still relatively small. Because of the inherent leverage that it offers, the ripples of “Smart Money” behavior are more easily seen by looking at options order flow than looking at trading in the stock market. (We discuss why this is in further detail in the “Why do we trade unusual options activity” section below.)
As small and nimble traders, we focus on capitalizing while these big funds are still amassing their market-moving position.
Supporting posts:
Don’t Make These Rookie Mistakes with UOA
Why do we trade unusual options activity?
Trading based on unusual options activity works to align our positions with those of Wall Street’s “Smart Money,” those with insider knowledge of upcoming news or important information that can move the price of a stock.
Can is the operative word. It doesn’t mean that the price of the stock will move. Unusual options activity is not a full-proof method to trading stocks. Those do not exist. The market is too big and too humbling for us to expect that. Instead, it is a way of trying to tilt the odds in our favor; a way of setting up a portfolio of trades with a goal of a positive return.
So, you may ask, why do we want to follow “Smart Money?”
As discussed above, the term we use for “Smart Money” could be company insiders trading on inside information or institutional firms building large positions. In general, it is traders or investors with a lot of resources and—critically—information that we don’t have as individuals.
The beauty of this strategy is that it doesn’t really matter to us who it is in particular. Whether that “something” is an upcoming acquisition or news on a successful (or unsuccessful) drug trial, it doesn’t matter. All that matters is that they might know something we don’t know and that “something” is expected to move the price of the stock—in a big way. And that is information that we act on.
How can you find trade ideas?
We pioneered a formula for identifying unusual options activity.
To trade unusual options activity, you have to get to the heart of what exactly makes a trade unusual. During decades of trading this activity, Jon and Pete Najarian have honed their strategy, automating much of what they learned into a proprietary Heat Seeker® algorithm that scans the order flow at all of the options exchanges.
There are a number of ways that a trade can be unusual: volume, open interest, the date of expiration, the strike price, and the price paid.
Let’s examine these factors:
- Volume: Volume is the number of trades over a given time period. This can be any combination of opening trades and closing trades. It is simply a measure of how many times a given security exchanged hands.
- Open interest: Open interest is the amount of contracts outstanding in the market. In effect, it is a gauge of interest in the contract at any point in time. If the open interest is 1, that means that there is one long contract AND one short contract. If the open interest is 100, that means that—across the whole market—there are 100 long contracts and 100 short contracts. Open interest is measured once a day at the end of the day.
- Expiration date: All options have expiration dates. This is the date by which an option either has to be exercised or the contract is void.
- Strike price: The price at which an option allows the holder to buy (calls) or sell (puts) the underlying stock is called the strike price. For any given expiration date, there can be any number of strike prices—which are either in-the-money or out-of-the-money relative to the price at which the stock is trading.
- Price paid: The price paid is how much the option buyer paid for the option. Like stocks, options have two prices: a bid and an ask. The bid represents the price at which someone is willing to openly buy the option. The ask represents the price at which someone is willing to openly sell the option.
All of this information is publicly available as reported when trades happen. Some sites have compiled free screeners that use a one-factor model to present unusual options activity. For example, popular ones look at the ratio of volume to open interest in a particular option. These can be a good place to start, but are often cluttered with a lot of noise that you will want to narrow down with additional filters.
Supporting posts:
Revealed: The Smart Money Behind Tech’s Big Run
How do we screen options activity?
It’s really in how these multiple factors come together as one that makes a trade truly unusual.
For example, we like to see high volume relative to open interest. Let’s say that we see 10,000 calls are purchased versus open interest of 250 contracts. Besides the fact that the volume is high, the fact that it exceeds open interest tells us without a doubt that the trade is an opening order. Someone is making a big bet (1,000,000 share equivalent) in the direction of the price.
Below is a chart that maps the likelihood flagged activity will trigger an unusual options activity trade idea based on the factors that we use as inputs in the unusual options activity scanner.
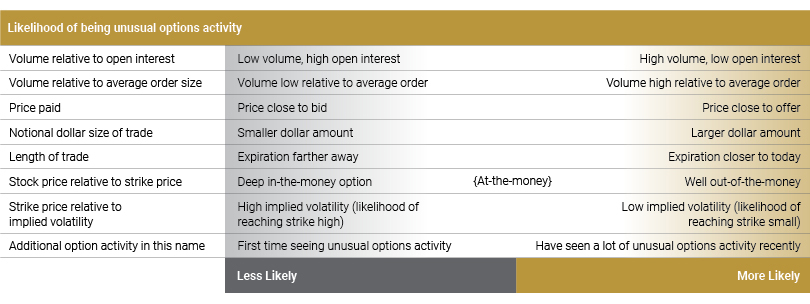 Knowing what we’ve described about unusual options activity, the profile of the “perfect trade” is likely obvious. If a trade is a large notional dollar amount, traded on the offer, with high volume that exceeds open interest, well out-of-the-money, and a small likelihood of the price naturally reaching there as it relates to implied volatility, then that trade is certainly unusual. In other words, the trade clearly doesn’t make sense. Why would someone seemingly “throw away” a large amount of money?
However, a more common unusual options activity trigger is not so obvious. That’s where experience and added research come into play.
For example, around some major news events, the implied volatility measure may prove less important. The market may be expecting a large move. If there is about to be a phase 3 drug trial announcement, it wouldn’t be unusual to see implied volatility very high. That doesn’t mean to say that if there was large call buying activity well out-of-the-money, it wouldn’t flag as unusual. It might. Remember, we’re looking for activity that “Smart Money” traders are making. And these are exactly the times that they may be active.
On the opposite side, it doesn’t mean that a large trade executed on the offer with a close expiration date is unusual. There are other factors that could make it less unusual. If that order appears paired with a stock transaction, for instance, it could be a hedging transaction. There’s nothing wrong with that; it’s just not unusual options activity.
While there is a formula, it is not exactly straightforward. You know it when you see it. Just like a polar bear walking on a beach. In your trading, you are going to have to work to identify how much of this criteria must be met to make a trade “unusual” to you.
Supporting posts:
Three Keys to Identifying UOA
What are examples of unusual options activity?
Every day, Market Rebellion’s Heat Seeker algorithm flags dozens of potential trades. This doesn’t mean that all of these trades are actionable. It just means that they passed the first level test.
From there, we filter even further with a mixture of the criteria above. Let’s take a look at a few recent examples.
GLUU gets bought by Electronic Arts
Here’s an example from February 2021. Starting in November 2020, we started flagging buying in GLUU, with activity in March and June.
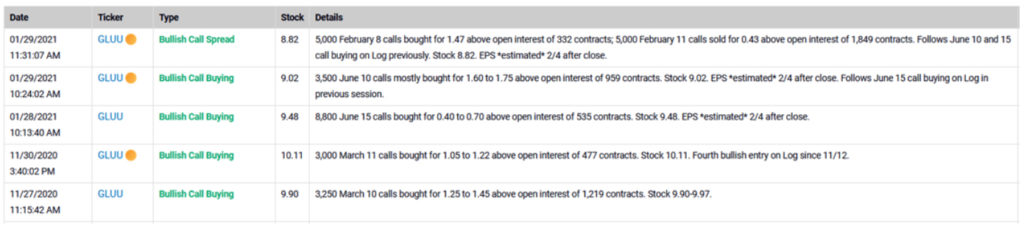 The orange dots indicate what we call “unusual” unusual options activity. This activity is particularly ripe for trade ideas.
How’d that play out? On February 8, it was announced that Electronic Arts was buying GLUU for $12.50 a share, a nice premium over the $10 calls that were initially purchased.
We spotted Tilray before it surged.
Starting in 2021, our Heat Seeker algorithm spotted consistent activity in Tilray, one of the leading marijuana stocks.
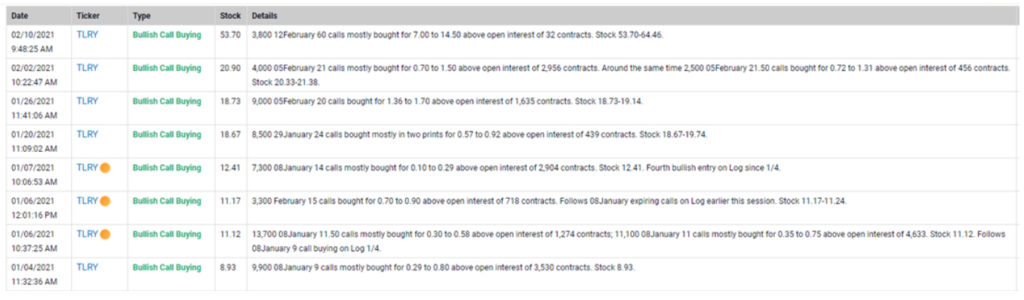 With the stock trading below $9, there was buying of at-the-money calls. The stock rose, and more and more unusual options activity appeared. Ultimately, the stock kept surging from the $9 price point to above $60, before its price ultimately fell back lower.
Each day, Jon Najarian gives three UOA trade ideas live in 3@3 with Jon Najarian. You can watch the latest episode of the 3@3 below.
Unusual options activity trade alerts
Market Rebellion specializes in unusual options activity trade ideas. Jon and Pete Najarian have traded UOA for more than 30 years—from when they were on the floor of the Chicago Board Options Exchange (CBOE) to today. This strategy has survived the death of the trading floor and migration to electronic trading, the rise of high-frequency trading, popularity of ETFs and passive investing, and every other major change for the past three decades. It has weathered the test of time and continues to perform as a reliable indication of where the “Smart Money” is investing.
If you are interested in trade ideas or alerts triggered by unusual options activity, here are some questions that you may want to consider before choosing a trade alert service:
-
What are the filters that the options activity goes through before it is presented as a trade idea?
As mentioned above, the idea of a trade being unusual options activity based on meeting one criteria (e.g., volume of the trade is greater than open interest) is too simple. True, that is a necessary condition of unusual options activity, but it is not sufficient to trade off of the order flow. Instead, understand the process by which trade ideas are chosen from the potential unusual options activity.
-
Is there a methodology to controlling risk in the trade?
At Market Rebellion, our unusual options activity trades are all centered around the idea of controlling risk, with a firm understanding in the fundamentals and mechanics of options trading. What’s that mean in practice? When we present a trade idea, we don’t just regurgitate the trade that triggered the alert. We think about how the trade will perform as the price of the stock moves and time decay sets in.
One example, we frequently buy higher delta calls or puts than the triggering trade (or may even put them on as a vertical spread instead of an outright call/put purchase). Yes, that means that we pay more than if we bought out-of-the-money options, but it also means that we lower the amount of potential profitability. We’re giving up the possibility of home run trades in exchange for what we hope are more doubles and triples. That’s an exchange we are happy to make. -
Can you commit to a portfolio of trades?
If you are interested in unusual options activity because of exponential gains from front-running potential news, that’s normal. But, you should also realize that this is still a probability-based analysis. The market can (and will) do what the market wants. A company may release great news and have the stock price barely budge… or even go down. In order to get the most from UOA order flow, you have to commit to more than a few trades. After all, this is still a percentage game. One or two results are not indicative of the power of this strategy over the long term.
Start Trading
Everyone is looking for an edge in the market. But, unusual options activity isn’t a magic bullet. It takes analysis and work, and then proper position sizing and management. It’s more challenging than just viewing where big money flows are going. When done properly and viewed in the context of a complete portfolio, however, it can be a powerful tool for your portfolio.
If you are ready to get started trading unusual options activity, then tell us a little bit more about yourself in order for us to come up with a personalized trading plan to connect you with the options education or trade ideas that will help you reach your goals.
Explore unusual options activity memberships from Market Rebellion’s best in the business trades:

